How to add a Phylopic icon to your graph in R
Phylopic is an online database of silhouettes of species. Most are freely available, with various copyright licences. It’s a great resource for scientific illustration or making cool presentations.
One way I wanted to use Phylopic was to add a silhouette of an animal directly to an R figure. You could search Phylopic yourself and copy the image id to add the icon to the graph but where’s the fun in that?
rphylopic is an R package that can search and retrieve icons directly from Phylopic. You can use rphylopic with ggplot2 or base graphics.
The process of searching Phylopic and pulling out the image id is not straightforward, and I didn’t find a step-by-step guide I liked for doing so, so here is a reproducible example using the built in dataset beaver1 - a time series of a beaver’s body temperature.
The data looks like this and we want to add a beaver icon to the top left corner:
beaver_plot <- qplot(beaver1$temp,x = seq_along(beaver1$temp), geom = "line", xlab = "Time", ylab = "Temperature")
beaver_plot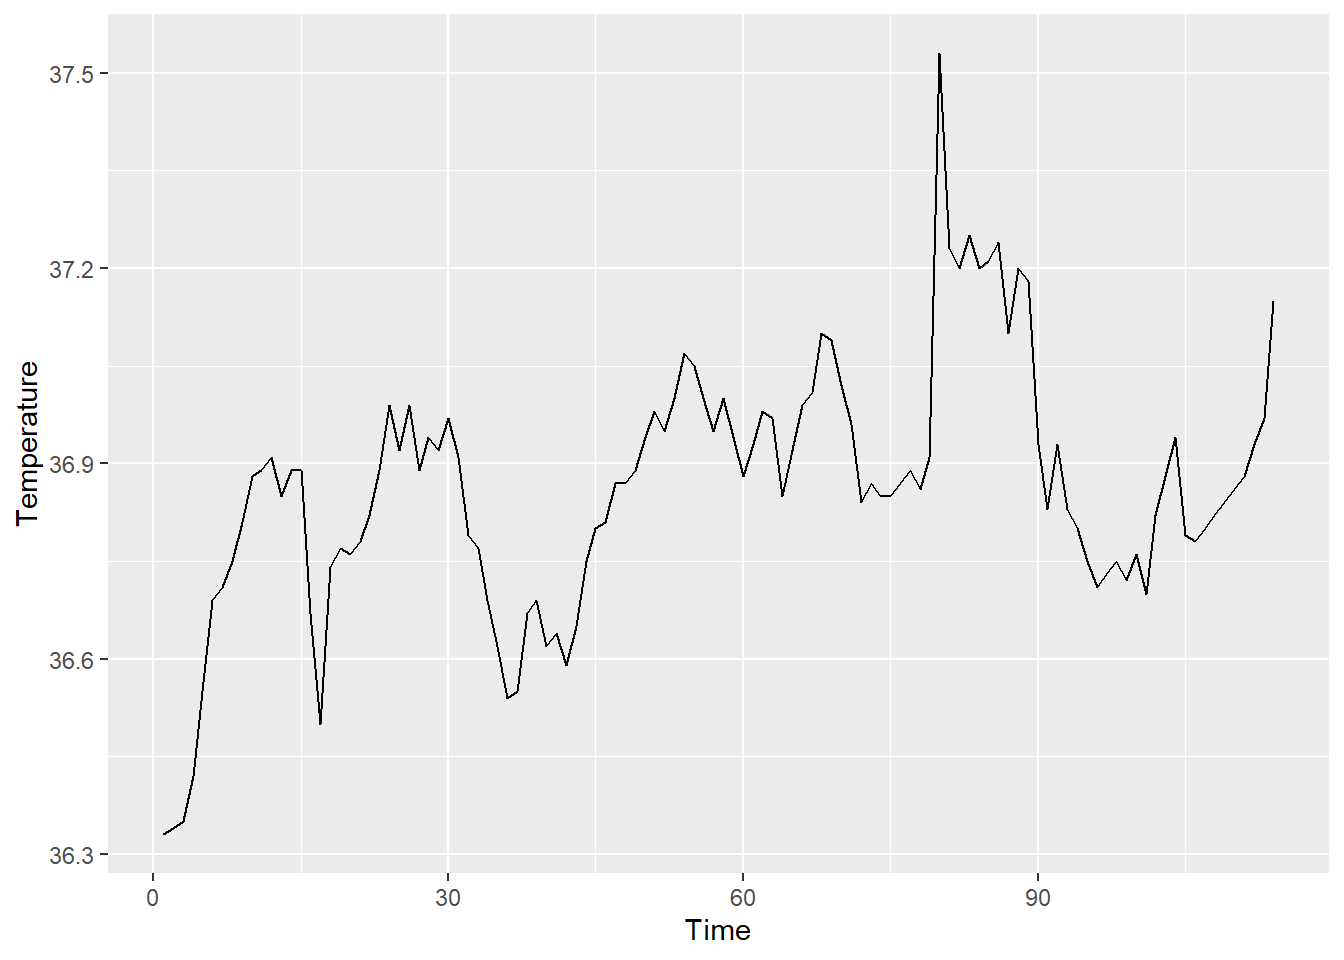
Step-by-step guide to adding a Phylopic icon
1. Getting the right species
You can search Phylopic by species using name_search. You might get multiple hits because there may be multiple matches in the databases. It’s worth cross-referencing the NameBank ID with the website. The NameBank ID is located at the top right of the webpage. In this case we want the first option - 109179.
library(rphylopic)
beaver <- name_search(text = "Castor canadensis", options = "namebankID")[[1]] # find names
beaver
2. Extracting the id of the icon you want
Use name_images to list all the beaver icons available. In this case, there are two versions of the beaver icon we can use - listed as $same[[1]] and $same[[2]] with unique uid. The uid is the unique id of the icon. Again, it’s handy to check the uid with the website. You can find the uid on the website by clicking the actual icon you want to use and copying from the address bar.
beaver_id_all <- name_images(uuid = beaver$uid[1])  # list images
beaver_id_all
Let’s use the second icon and extract only that uid.
beaver_id <- name_images(uuid = beaver$uid[1])$same[[2]]$uid  # get individual image id
beaver_id
3. Getting the icon itself
Now we can get the actual image using image_data. Each icon is available in different sizes, from a thumbnail (64 px) to large icons (1042 px). We will get a 256 px icon so that the resolution is high enough to avoid pixelation.
beaver_pic <- image_data(beaver_id, size = 256)[[1]] # get actual icon, define size. Don't run this alone4. Adding the beaver icon to the plot
Use add_phylopic to add the icon to a ggplot2 graph. You need to specify the x and y axis co-ordinates for the graph. Use ysize to change the size of the icon. Use alpha to control the transparency. colour will change the colour.
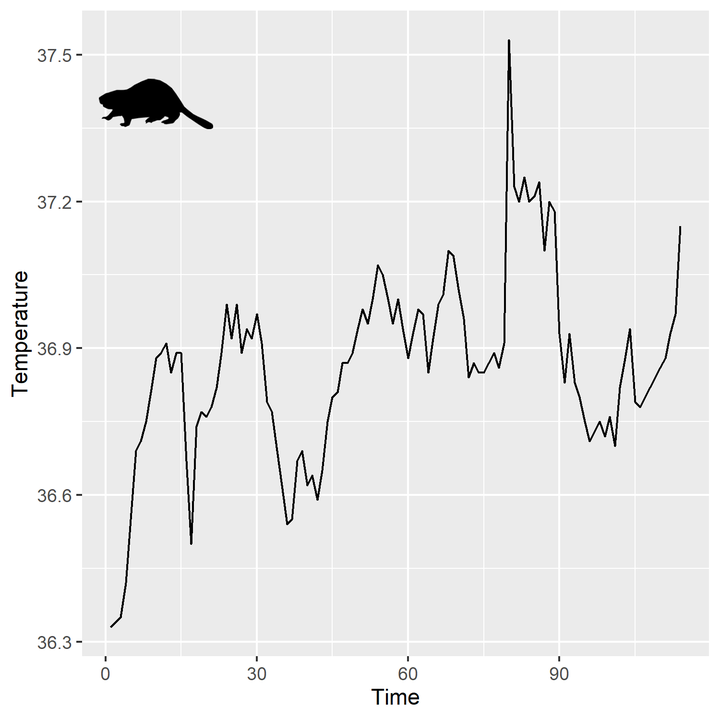
beaver_plot + add_phylopic(beaver_pic, alpha = 1, x = 10, y = 37.4, ysize = 10)
The final plot
And that’s it! 🦫
Other uses of rphylopic
- You can add the icon as a background image but I would question why that would be a good idea from a graphic design perspective. To do so, you don’t need to specify any other variables in
add_phylopic. - You can also use icons as data points by plotting each icon in place of the regular point within a for loop. You can see an example in the
rphylopicdocumentation.
Jacinta Kong
Postdoctoral Fellow
My research interests include species distributions, phenology & climate adaptation of ectotherms.