This tutorial was originally presented to NERD club on 18/11/2020.
This document contains two examples of functions and an example of how functions can be integrated with loops.
User defined functions take the general form of
function(inputs){processing inputs; return(output)}
Predator-Prey interactions
We will use a simulation of predator-prey interactions as an example. Predator-prey interactions simulate how many prey a predator can capture after a specific amount of time and for a given density of prey. We use this example with undergraduate biology students to demonstrate statistical modelling, experimental design and collecting data.
Normally we would get students to do this laboratory practical in class by picking up counters and putting them in jars while blindfolded. We can also see whether the use of different types of jars affects the efficiency of the predator. This is the experimental design:
- Response variable - Number of prey caught (
Ha) - Total foraging time - 1 minute, a constant (
T) - Predictor variables:
- Prey density - user defined treatments (
H) - Type of jar used - jar with a lid or no lid (
yesorno)
- Prey density - user defined treatments (
Normally the students will collect data to parameterise the functional response. Instead I’ve created a function that will predict new values of prey captured using a functional response formula that is already parameterised.
Let’s look at the function:
An interactive function
R has some capacity to be interactive. It can ask a user to input variables.
The function functional_response will return the number of prey captured for a given prey density and type of jar used. The function will ask for these two inputs each time the function is run. Look at the code below and try to understand the different components. Then try running the code yourself with different inputs.
#### Interactive function
# Simulation of the predator-prey functional response - DO NOT CHANGE
# To run: click Source (cmd or ctrl+shift+S) or Run All (ctrl+alt+r)
# Or source("<insert file location here>", echo = FALSE)

functional_response <- function(){

  # Introduce the simulation to the user - prints a message
  cat(paste(
    "",
    "You have some counters (prey), a piece of A4 paper & a jar.",
    "You spread the counters randomly on the A4 sheet.",
    sep="\n"))

  # Ask the user for the prey density for the functional response
  prey_density  <- readline("How many prey counters are used? ") # ask for prey density

  # Check the user has inputted a number properly
  if(!grepl("^[0-9]+$", prey_density)){ # check whether the input contains numeric characters between 0-9 using regex (regular expressions)
    message("Please enter an integer") # If the input is not a number, tell them to do it again
    return(functional_response()) # Return to the beginning of the function and start again
  }
  prey_density <- as.integer(prey_density) # If the prey density input is a number, turn it into an interger

  # Ask the user for the type of jar used
  cat(paste(
    "",
    "Every second you (the predator) tap the sheet to find and pick up a prey counter while blindfolded.",
    "You have 1 minute to put as many prey counters as you can in the jar.",
    "There are two types of jars you can use while handling prey.",
    "Enter 1 to use a jar with a lid that you have to open and close.",
    "Enter 2 to use a jar without a lid.",
    "",
    "What type of jar is used?",
    sep="\n"))
  lid_used <- menu(c("Lid", "No Lid"))

  # Calculate the number of prey caught (the functional response) based on the user defined input above
  if(lid_used != 0){ # Check that the use has chosen the jar used properly (1 or 2)

    # Use this model if using a jar with a lid
    if(lid_used == 1){
      Ha <- (0.2 * prey_density)/(1 + 0.2 * 0.03 * prey_density)
    }

    # Use this model if using a jar without a lid
    if(lid_used == 2){
      Ha <- (0.7 * prey_density)/(1 + 0.7 * 0.05 * prey_density)
    }

    # Add in some variation around the predicted value so that users don't get the exact parameterised functional response
    Ha <- Ha + sample(seq(-3,3), 1)

    # Make sure there are no negative prey items caught!
    if(Ha < 0){
      Ha <- 0 # Make prey caught 0 if less than 0
    }

    # Make sure the number of prey caught doesn't exceed the number of prey available!
    if(Ha > prey_density){
      Ha <- prey_density # If prey caught is greater than the number of prey available, make it the maximum possible
    }

    # Print a message showing the results
    message("The number of prey caught is ", floor(Ha), ". Well done!")
  }
}

# Actually run the function and tell R that it's interactive
if(interactive()) functional_response()
Note:
- The function doesn’t have any inputs in
function()because it will ask the user for them each time readlineis the function to ask for a single user inputmenuis the function to ask the user to chose from a number of options- Here the option is press 1 to use a jar with a lid or press 2 to use a jar without a lid
- There are two parameterised functional responses - one for a jar with a lid and one for a jar without a lid
flooris a function to round the number of prey caught to the lowest whole number
In the practical, students will need to run the above function for 10 prey densities, repeated 3 times, for both jar treatments - so 60 times in total. But we don’t have to do that manually - that is what loops are for!
Functions and loops
Here is a non-interactive version of the function above. It doesn’t have the printed messages asking for user input. This time, the function needs 3 inputs as indicated by function(prey_density, lid_used, total_time): the prey density used, the type of jar used and the total foraging time, respectively.
Run the code chunk to load the function into the R environment:
# Functional response function
functional_response <- function(prey_density, lid_used, total_time){

  # Check jar type is inputted correctly
  if (!lid_used %in% c("yes", "no")) {
    stop("Lid used is not inputted correctly. Use 'yes' or 'no' in all lowercase")
  }
  if(lid_used == "yes"){
    Ha <- (0.2 * prey_density * total_time)/(1 + 0.2 * 0.03 * prey_density)
  }
  if(lid_used == "no"){
    Ha <- (0.7 * prey_density * total_time)/(1 + 0.7 * 0.05 * prey_density)
  }
  Ha <- Ha + sample(seq(-3,3), 1)
  if(Ha < 0){
    Ha <- 0
  }
  if(Ha > prey_density){
    Ha <- prey_density
  }
  # message("The number of prey caught is ", floor(Ha))
return(floor(Ha))
  }
The function will check that the character vector indicating the type of jar to be used is correct because R is case sensitive. The function will return the number of prey caught Ha as indicated by return(Ha). The function return specifically tells R to tell us the output, otherwise R will keep it to itself! Only one output is allowed (unless extra steps are taken).
The rest of the function is the same.
Using the functional response function in a loop
Now let’s use a loop to do our entire experiment in one go! No manual inputs for us. In fact we can do as many treatments or replicates as we want. Let’s do prey densities between 5 and 100 in increments of 5 and 3 replicates. Since the function inputs are required we can set them up in the environment for the function:
# Set parameters for the function
total_time <- 1 # total foraging time in minutes
no_treatments <- seq(from = 5, to = 100, by = 5) # prey density treatments between 5 and 100
replications <- 3 # number of replications

# a numeric vector of prey densities for all treatments, jar types and replications
prey_density <- rep(rep(no_treatments, replications),2) # repeated twice for each jar type

# a character vector of the jar type
lid_used <- sort(rep(c("no", "yes"), length(prey_density)/2)) # "yes" or "no"
By setting up the parameters outside the function or loop, we can easily modify the parameters of the function and feed the new values into the loop. This helps us debug and is cleaner and easier to read.
Now for the actual loop itself. We need to be able to store the output of the looped function. Lists are the fastest way to do so in R because R is designed for lists and matrices.
# Create an empty list called prey_caught to populate
prey_caught <- list()

for(i in seq_along(prey_density)){
  # Run the functional response for the nth observation in the vector prey_density representing all our observations and save it to the list
  prey_caught[[i]] <- functional_response(prey_density = prey_density[i],
                                         lid_used = lid_used[i],
                                         total_time = total_time)

  # Prepare the list for further analysis
  prey_caught[[i]] <-  cbind(prey_caught[[i]], prey_density[i]) # add a column for the prey density used to calculate the number of prey caught for that observation (row)
  prey_caught[[i]] <-  cbind(prey_caught[[i]], 1/prey_caught[[i]]) # add a column for the inverse of the number of prey caught - for statiscally parameterising the functional response
  prey_caught[[i]][,3] <-  ifelse(prey_caught[[i]][,3] == Inf, 0, prey_caught[[i]][,3]) # Housekeeping - turn undefined values of prey caught (from calculating 1 divided by 0) into 0. If the number of prey caught was 0
}

# Turn our list into a data frame
prey_caught <- data.frame(do.call("rbind", prey_caught))

# Label the columns
colnames(prey_caught) <- c("Ha", "H","Ha.1", "HT.1") # ".1 is inversed columns"

# Add type of lid used to our data frame
prey_caught$lid_used <- lid_used- Here we are using a
forloop with the nth observation denotedi. This can be called anything you want butiis from mathematical notation. seq_alongis a useful function for telling which observation you are at for a vector - try it out on its own.- Lists can only contain one variable type, unlike a data frame, but that’s why they are fast and memory efficient for high performance computing
- If we were to add the jar type (a character vector) to the list within the loop, then all our numeric output will be converted to characters (default R behaviour) - not what we want!
do.callis a handy function for lists. It collapses multidimensional lists into one dimension, here appending them by rows (i.e. adding new observations by rows at the end)
Visualising the data
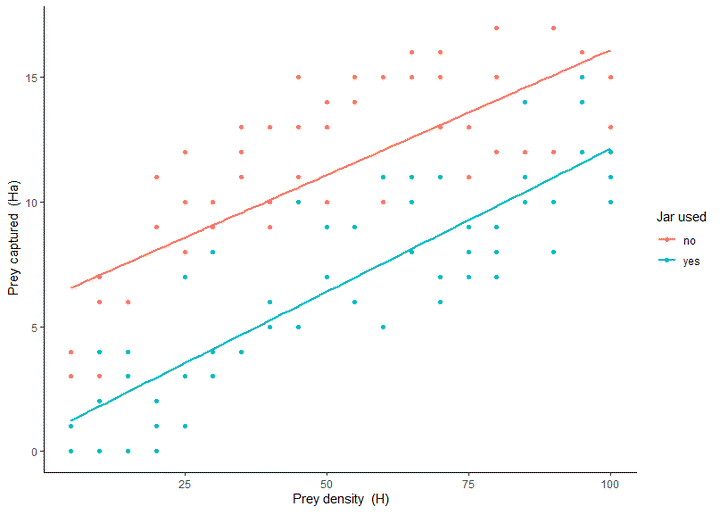
Now we can plot our results and conduct our linear regression:
library(tidyverse)

prey_caught %>% # Absolute values
  ggplot(aes(H, Ha, colour = lid_used)) +
  geom_point() +
  geom_smooth(method = "lm", se = FALSE, fullrange=TRUE) +
  labs(x = expression(paste("Prey density  (H)")),
       y = expression(paste("Prey captured  (Ha)")),
       colour = "Jar used") +
  theme_classic()
# Linear model
summary(lm(Ha.1 ~ HT.1 * lid_used, prey_caught))
Call:
lm(formula = Ha.1 ~ HT.1 * lid_used, data = prey_caught)

Residuals:
     Min       1Q   Median       3Q      Max
-0.27245 -0.05371 -0.01596  0.00899  0.84476

Coefficients:
                 Estimate Std. Error t value Pr(>|t|)
(Intercept)       0.07136    0.02262   3.155  0.00204 **
HT.1              1.00548    0.40029   2.512  0.01338 *
lid_usedyes       0.09517    0.03198   2.976  0.00356 **
HT.1:lid_usedyes -1.11833    0.56609  -1.976  0.05058 .
---
Signif. codes:  0 '***' 0.001 '**' 0.01 '*' 0.05 '.' 0.1 ' ' 1

Residual standard error: 0.1351 on 116 degrees of freedom
Multiple R-squared:  0.08913,   Adjusted R-squared:  0.06558
F-statistic: 3.784 on 3 and 116 DF,  p-value: 0.01242
That has saved us from running the code 120 times! Now we can do it in one!
Jacinta Kong
Postdoctoral Fellow
My research interests include species distributions, phenology & climate adaptation of ectotherms.